9 min read
Published
Anthropic IPO: Token of Appreciation
The company behind Claude is going public. What the offer terms, the business and the valuation debate look like ahead of Anthropic's Nasdaq listing.
Sandstone Insights (MST Financial Services)
General advice only. Read the general advice warning at the end of this article.

Ahead of the listing, we are sharing Sandstone Insights' market flash on the offer, the business and the valuation debate.
Need to know
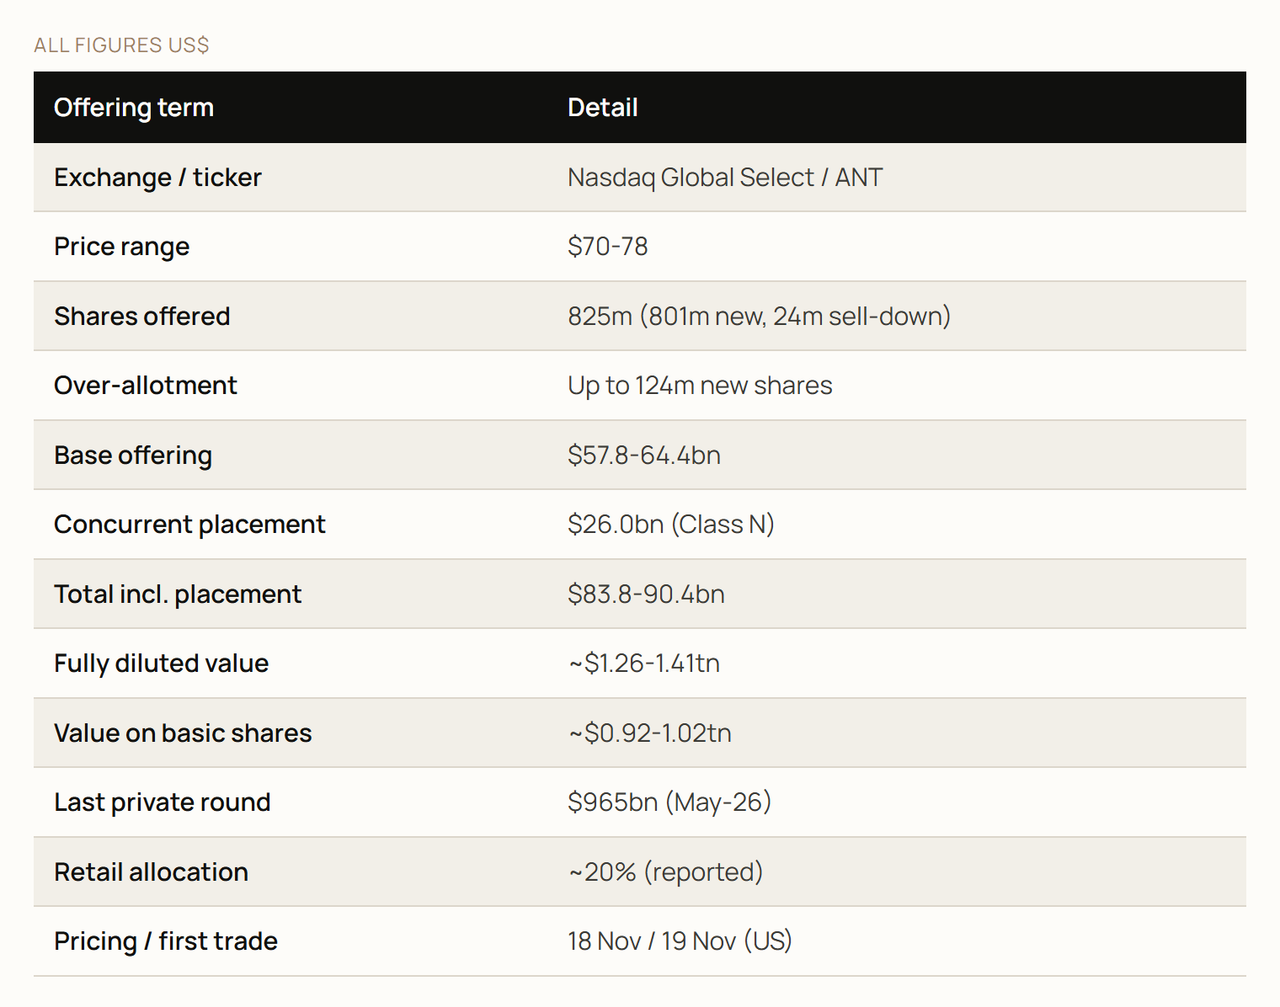
- Anthropic has set a $US70-78 range for 825m shares, raising up to $US64.4bn plus a $US26bn strategic placement, with an Australian retail offer that closed on 17 November and Nasdaq trading (ANT) from 20 November (Sydney time).
- The range implies a fully diluted value of ~$US1.26-1.41tn, +31-45% on the May private round but well below the ~$2tn discussed before the recent AI sell-off.
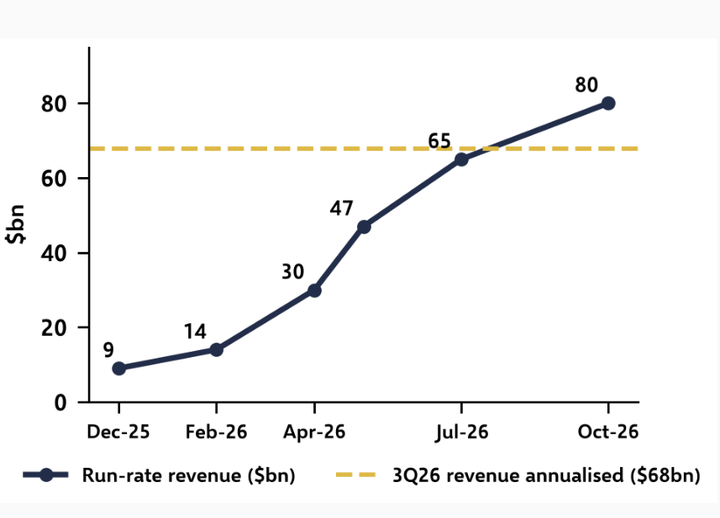
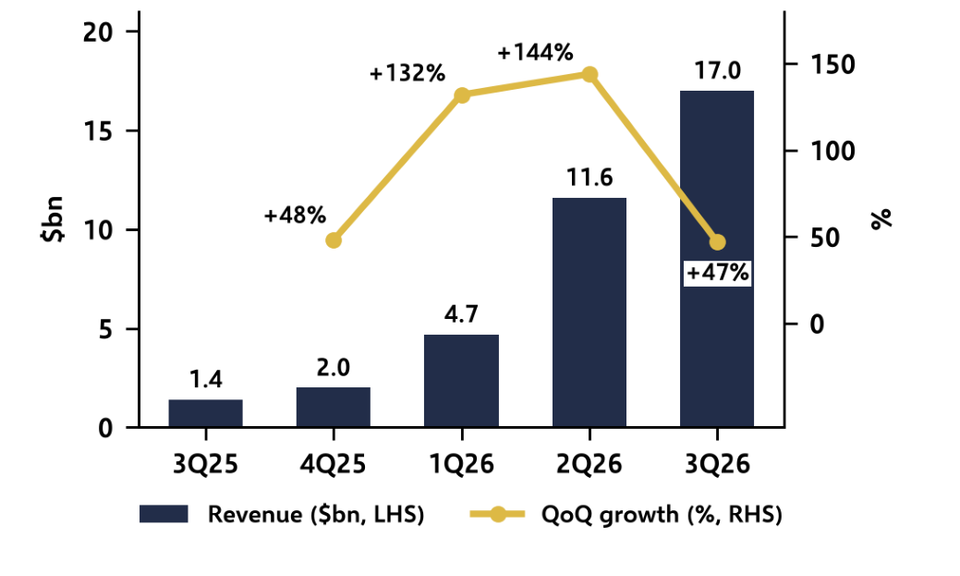
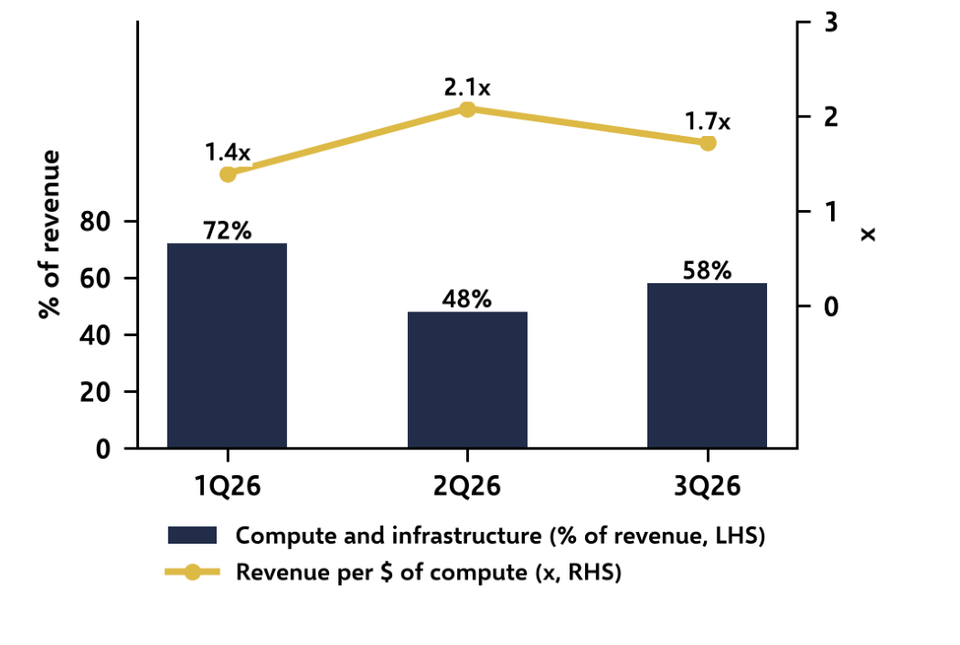
- 3Q26 revenue rose +1,127% yoy to $US17.0bn and the run rate reportedly passed $80bn in October, although QoQ growth slowed to +47% and compute costs rose to 58% of revenue.
Business overview
Anthropic (developer of the Claude family of AI models) earns most of its revenue from enterprises consuming its models, as usage-based billing through its API, cloud marketplaces and metered apps was ~80% of 1H26 revenue, with Claude app subscriptions the remaining ~20%. Cloud marketplaces were 44% of 9M26 revenue, so the hyperscalers are both its largest distribution channel and its largest compute suppliers.
The customer base has broadened quickly, as customers spending $US100k+ a year rose to >11,900 at September from >950 a year earlier and generated 74% of 9M26 revenue, while the top five customers fell to ~21% of 3Q26 revenue from ~36% in 1Q26. Coding remains the anchor use case: Claude Enterprise users who don't use Claude Code spend <$US75 per month, while the top 5% who do spend ~20x that.
Revenue grew from $US41m in 2023 to $US4.6bn in 2025 and $33.2bn in 9M26 (+1,206% yoy), but sequential growth is normalising, as 3Q26 revenue of $US17.0bn was +47% QoQ vs +144% in 2Q26, and the $US5.4bn dollar add was below 2Q26's ~$US6.8bn for the first time.
The run rate (the latest four weeks of usage revenue annualised plus current monthly subscriptions annualised, which runs ahead of reported revenue while growth is this fast) went from ~$US9bn at end 2025 to $US65bn in July and reportedly >$US80bn at end October, suggesting 4Q26 is tracking above 3Q26's $US68bn annualised base.
Customer-serving gross margin was 85.5% in 9M26 vs 29.4% in 9M25, although this excludes model training compute, which sits in R&D. Total compute and infrastructure expense rose to 58% of 3Q26 revenue from 48% in 2Q26, as Anthropic bought $US5.0bn of short-term capacity at well above contract rates (likely to meet demand rather than ration customers). That swung GAAP operating income from +$US974m to -$US567m, including a $US1.96bn non-cash donation charge. The $US23.3bn 3Q26 net loss was mostly (~$US21.9bn) non-cash fair value movements on convertible notes.
IPO terms and prospectus
Alongside the 825m share offer, $US26bn of non-voting Class N shares are being placed at the offer price with Google ($US10bn), Nvidia ($US10bn), AMD ($US2.5bn), Broadcom, Micron and Microsoft ($US1bn each) and TSMC partners ($US0.5bn). The Google and AMD amounts are reported to offset existing commitments rather than add fresh cash. Net proceeds of ~$US84.6bn at the midpoint lift pro forma cash and investments to $US212.7bn, from $US131.8bn at September.
The range reflects a material reset in expectations, as a ~$US2tn value was being discussed in September and ~$1.5tn in early November, before the AI sell-off pushed some prospective buyers toward $US1.0-1.3tn. Headline values vary with the share count used: ~$US1.26-1.41tn fully diluted (~18.0bn shares, including the Amazon notes, options and RSUs) or ~$US0.92-1.02tn on the 13.1bn shares outstanding after the offering. The book is reported to be covered within the range, and ~20% of the deal is reportedly targeted at retail, well above the typical 5-10%.
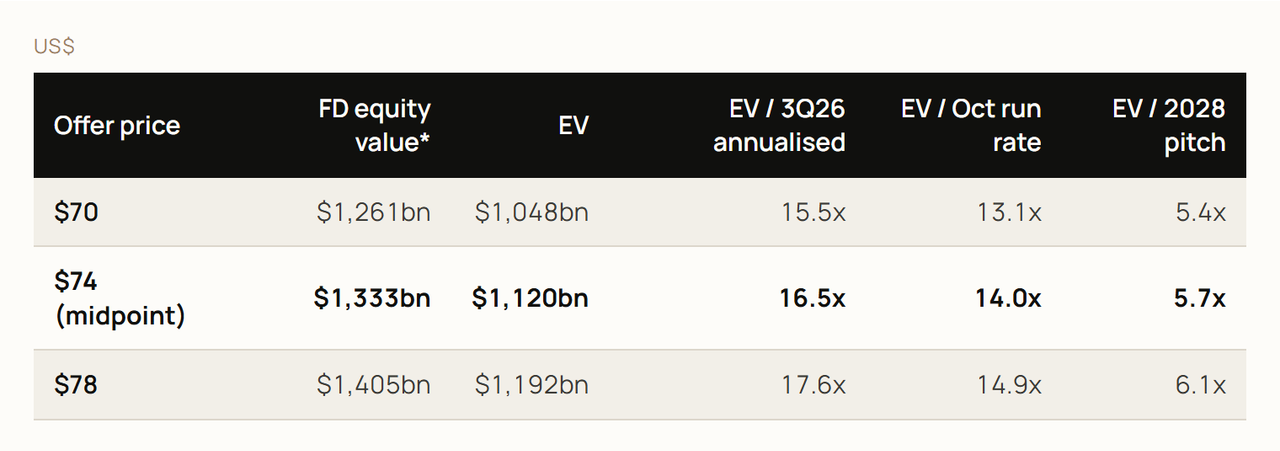
The prospectus carries no forecasts, but the company was reported in August to be pitching investors on 2028 revenue of ~$190-200bn (various news reports), a figure set when the run rate was $65bn. At the $US74 midpoint, enterprise value of ~$US1.12tn (fully diluted value less pro forma cash) is ~16.5× 3Q26 annualised revenue, ~14x the October run rate and ~5.7x the 2028 pitch. Earlier in the process, Palantir at ~53× 2026 revenue and Cloudflare at ~42x were cited as reference points.
The cost base is largely contracted, as the latest filing shows ~$US901bn of aggregate committed spend (substantially all compute and infrastructure), ~11x the October run rate. Of this, $US70.7bn is due in the next 12 months, $US451.6bn before end 2030 and $186.2bn is subject to termination rights or contingencies. Much of it is take-or-pay, including a Google minimum spend of up to ~$US121bn payable regardless of usage, while the short-term capacity bought in 3Q26 is more flexible.
Public shareholders get economics with limited control, as a single Class F share held by the seven co-founders carries 50.1% of votes and the Long-Term Benefit Trust elects four of the seven directors through its Class T share. Anthropic remains a public benefit corporation and has placed 5% of fully diluted shares in a Public Benefit Fund, with scope for a further 2% each time the share price rises 50%. A staggered lock-up lets some non-founder insiders sell 10% on day one, and a ~$US14.2bn non-cash Restricted Stock Unit (RSU) expense will be recognised on completion.
Scenario analysis
We frame valuation on EV to run-rate revenue, since revenue is consumption based and operating earnings are not yet a stable base. We use ~18.0bn fully diluted shares and $212.7bn of pro forma cash. These are illustrative scenarios, not a fair value.
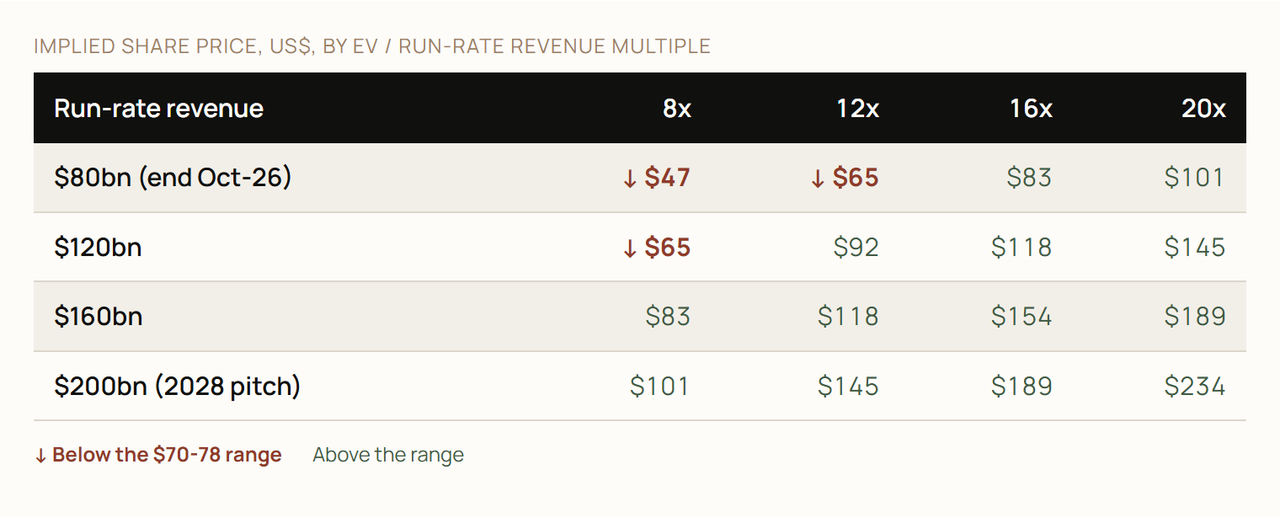
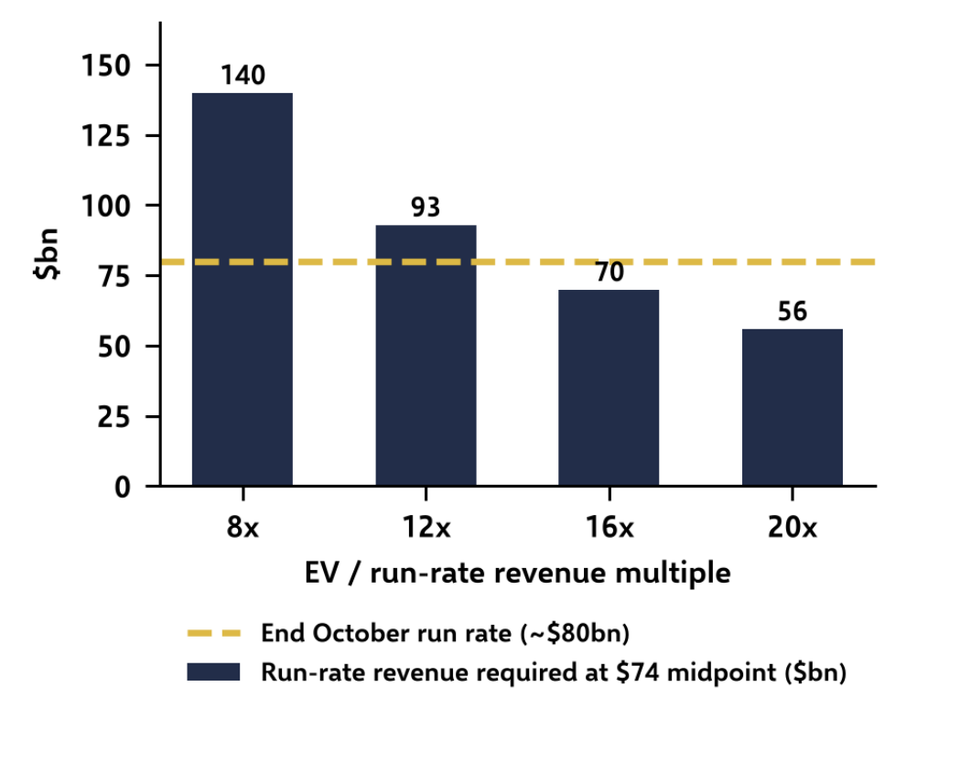
At the midpoint the market is paying ~14x the October run rate, so the debate is how fast the multiple compresses relative to revenue growth. At a 12x multiple, still a premium to most large cap software, the price needs a ~$93bn run rate, ~16% above October and within reach at the ~$10bn reportedly added in October alone, while an 8x multiple needs ~$140bn. The downside case is a run rate that stalls near $80bn and de-rates to 8x (~$47, -36.0% vs $74), while reaching the 2028 pitch at 12x implies ~$145.
On earnings, the 2028 pitch at a 20% net margin gives ~$39bn of profit, putting the midpoint on 34× 2028 earnings, or ~68x at a 10% margin and ~23x at 30%. The scenarios are not independent of margin: with most compute contracted on a take-or-pay basis, the same 3Q26 compute spend on 20% less revenue would have absorbed ~73% of revenue rather than 58%.
Key debates
Pricing is the swing factor, as Anthropic itself cut customers' cost per task by ~40% with Opus 5.5 and ~25% with Fable 5.1 in September, and open-weight models compete on price. Volume has more than offset price so far, with 3Q26 revenue still +47% QoQ through those cuts, S1 filing does not split revenue into price and volume.
Monetisation is concentrated in coding, as Claude Enterprise users who don't use Claude Code spent <$75 per month in 3Q26, so sustaining growth depends on agents spreading beyond software teams. Cross-sell is progressing, with >50% of $100k+ customers using both the developer platform and a Claude app in 3Q26, up from ~30% in 4Q25.
The IPO funds the compute build but doesn't settle the return on it, as ~$901bn of commitments against an $80bn run rate requires demand to keep compounding well beyond coding, and public holders have limited say over how that capital is deployed.
A note of caution
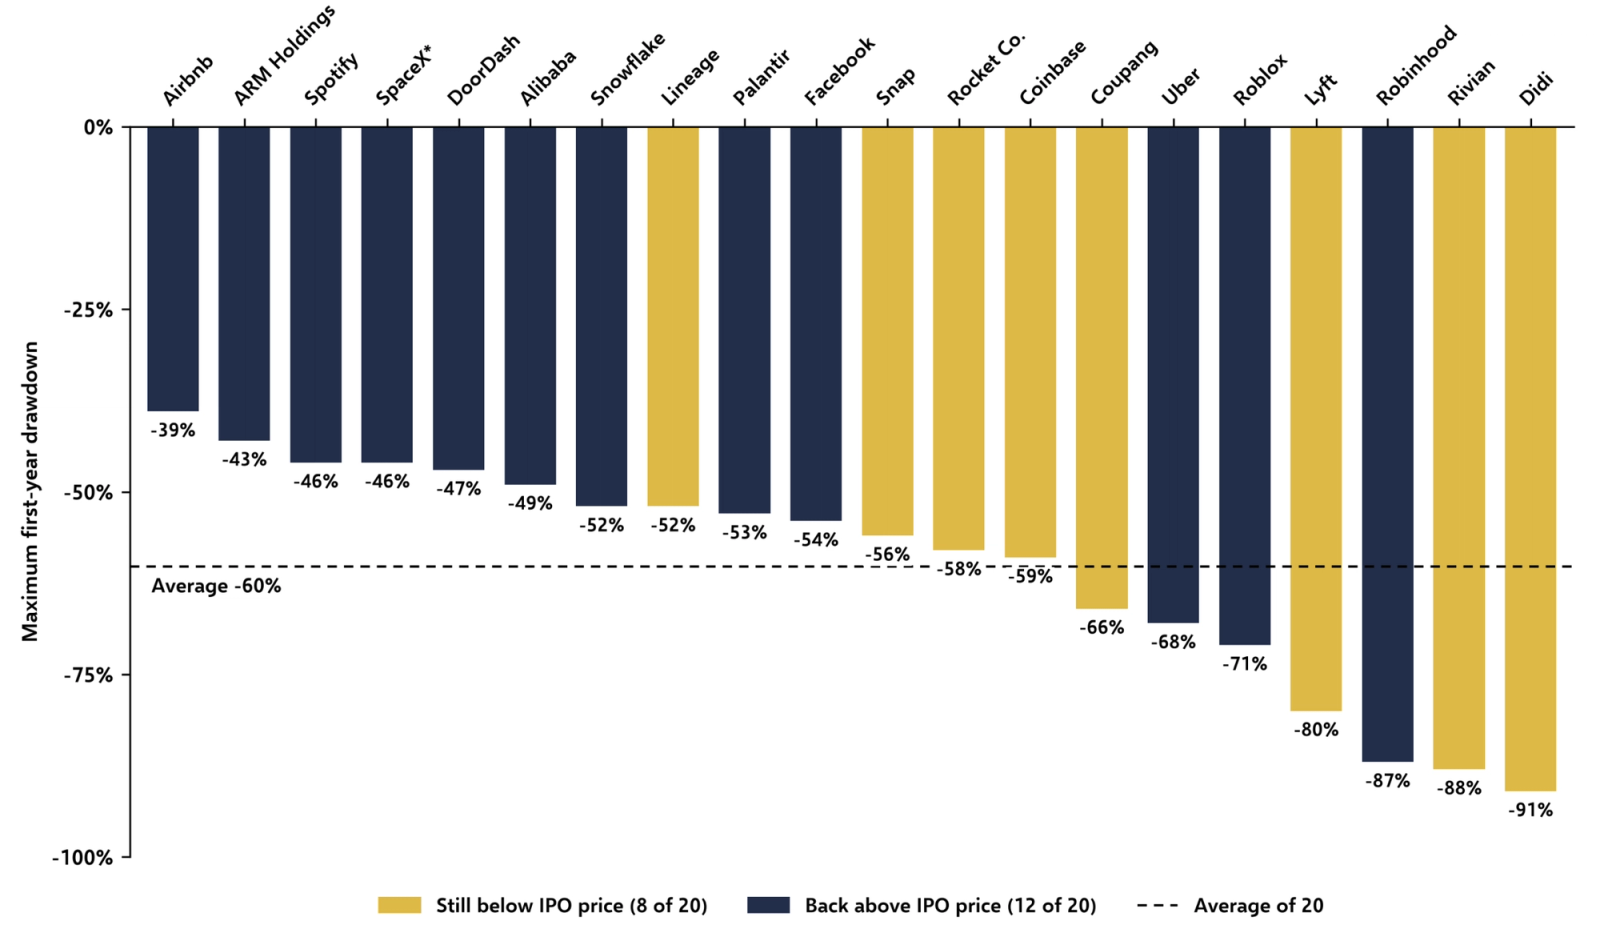
History points to volatility after listing, as each of the 20 largest IPOs and direct listings since 2010 fell at least -39% from its peak at some point in its first year. The average maximum drawdown was -60%, and 8 of the 20 still trade below their offer price. SpaceX, the only other trillion dollar listing, is the closest comparable: it priced at $135, reached a record close of $201.80 four days later, then fell -46% to $108.27 by early August around its first results, before recovering to $143.09 (+6.0% above its offer price) by 10 November. Anthropic's deal shares several of those features, with a ~20% retail allocation, a staggered lock-up that lets some insiders sell on day one, and a valuation that relies on run-rate growth continuing, so the first-day price may say little about where the shares settle.
For Australian investors
The Australian retail offer closed on 17 November. For Australians looking at the shares once they trade, some features differ from an ASX-listed company:
- $US exposure: the price is in $US, so $A conversion and exchange rate moves affect returns.
- Nasdaq only: the shares trade overnight Sydney time, with no ASX listing, continuous disclosure or Australian takeover protections.
- Tax: dividends aren't expected and would carry no franking. Shares sold before 1 July 2027 get no CGT discount; for gains after that date, indexation and a 30% minimum tax replace the 50% discount.
Timeline
- Confidential filing: 1 Jun 2026
- Public S-1: 26 Oct 2026
- S-1/A with 3Q26 results: 2 Nov 2026
- Price range and roadshow: 10 Nov 2026
- Expected pricing: 18 Nov 2026 (US)
- Expected first trade: 19 Nov 2026 (US)
Pricing and trading dates are reported, not confirmed by the company.
What to watch
- Final price vs the $70-78 range and any upsizing
- Whether the 31 October run rate is disclosed in the final prospectus
- 4Q26 revenue and compute as a % of revenue as short-term capacity rolls off
- Day-one insider selling under the staggered lock-up
This market flash was written by Sandstone Insights, the research division of MST Financial Services, and is shared with MST's permission. Sandstone published it on 11 November 2026, before the Australian retail offer closed on 17 November; we are sharing it on 18 November as background on the company ahead of its expected Nasdaq listing. Figures and dates are as at 11 November, and "we" in the analysis above refers to Sandstone Insights.
Important notice
Research prepared by Sandstone Insights, a division of MST Financial Services Pty Ltd (ABN 54 617 475 180, AFSL 500557) ("MST"), and shared by Solomons with MST's permission. Originally published 11 November 2026.
This document has been prepared from publicly available information, and other sources considered reliable as at the date of publication. MST has not independently verified all information contained in this document and makes no representation or warranty as to its accuracy, reliability, timeliness or completeness. The information is subject to change without notice.
This document is a company follow-up primer prepared for informational purposes only. It does not constitute an offer, invitation or solicitation to subscribe for, purchase or sell any securities, nor does it constitute a recommendation to participate in the proposed Anthropic initial public offering. Nothing in this document should be relied upon as a representation or assurance regarding the proposed IPO, Anthropic or the future performance of any securities.
MST is not acting as an adviser, manager, underwriter, arranger, Joint Lead Manager or distributor in connection with the proposed Anthropic IPO and will not receive any fee or other benefit for acting in any such capacity in connection with the proposed offer.
Any advice contained in this document is general advice only and has been prepared without taking into account the objectives, financial situation or needs of any particular person. Recipients should make their own independent assessment of the information and, where appropriate, obtain independent professional advice before making an investment decision.
Information concerning the proposed Anthropic IPO, including the proposed timetable, offer size, valuation and other offer terms, is based on publicly available information as at the date of this document and remains indicative and subject to change. This document is not a prospectus, product disclosure statement or other offer document. Recipients should refer to the final prospectus and other official offer documentation, if and when available, before making any decision in relation to the proposed IPO.
To the fullest extent permitted by law, MST, its related bodies corporate and their respective officers, employees, agents, advisers and representatives accept no liability for any direct or indirect loss arising from any use of, or reliance upon, this document or the information contained in it.
MST and its related bodies corporate, officers and employees may from time to time hold positions in, trade or otherwise have interests in securities or financial products referred to in this document. MST manages actual and potential conflicts of interest in accordance with its conflicts management arrangements.
Originally published
Continue the thought
Markets & investing · 28 July 2025 · 2 min read
The one big, beautiful bill that may not be so beautiful for Aussies
In 2025 a proposed United States tax bill, dubbed the One Big Beautiful Bill, raised concerns for Australian super funds and businesses with US exposure. Here is why it mattered.
Markets & investing · 26 November 2024 · 3 min read
Interest Rates: Balancing Inflation and Economic Strain
This article breaks down the issues that shaped Australia's interest rate debate, from political pressure on the Reserve Bank and inflation to a landmark payroll tax decision involving Uber.
Wealth & family · 17 November 2026 · Luke Aitken · 4 min read
How much super do you need to retire?
Two people with the same balance and the same average return can end up tens of thousands of dollars apart in retirement. What to plan for, and the questions to ask about your own plan.